
Seek Research · Real-estate opportunity analysis
Low-cost mapping that speeds up opportunity analysis
How ByteNana gave Seek Research a fast, inexpensive Power BI mapping tool — deployed straight into SharePoint and fed by an ETL pipeline that keeps public property data current.
Analysis priced out of a map
Seek Research's opportunity analysis depended on public property data that lives scattered across municipal portals — parcels in one place, ownership and tax records in another, building permits in a third. Pulling it together meant manual lookups, spreadsheet reconciliation, and switching between half a dozen public sites to answer a single question about a single block. Commercial GIS platforms could have solved it, but the licensing and rollout cost was out of proportion to the job. They needed the analytical power without the enterprise price tag — and they needed it inside the tools their team already used every day.


A mapping layer on top of the data they already own
We built a custom ETL pipeline that automates the collection and normalization of public property data, then surfaced it through a Power BI mapping interface deployed directly in SharePoint. No new platform to license, no new tool for the team to learn — analysts open the map where they already work, and every parcel arrives already geolocated, normalized, and joined to its ownership, zoning, tax, and permit records.
The pipeline
Python & Azure Data Factory — scheduled jobs that collect public parcel, ownership, tax, and permit data and normalize it into one schema.
The spatial store
SQL Server & PostGIS — geolocated records held in a spatial database built for fast parcel-level querying.
The interface
Power BI in SharePoint — a multi-layer map the team opens inside the workspace they already use, with Google APIs for imagery and Street View.
Seek Maps, in use
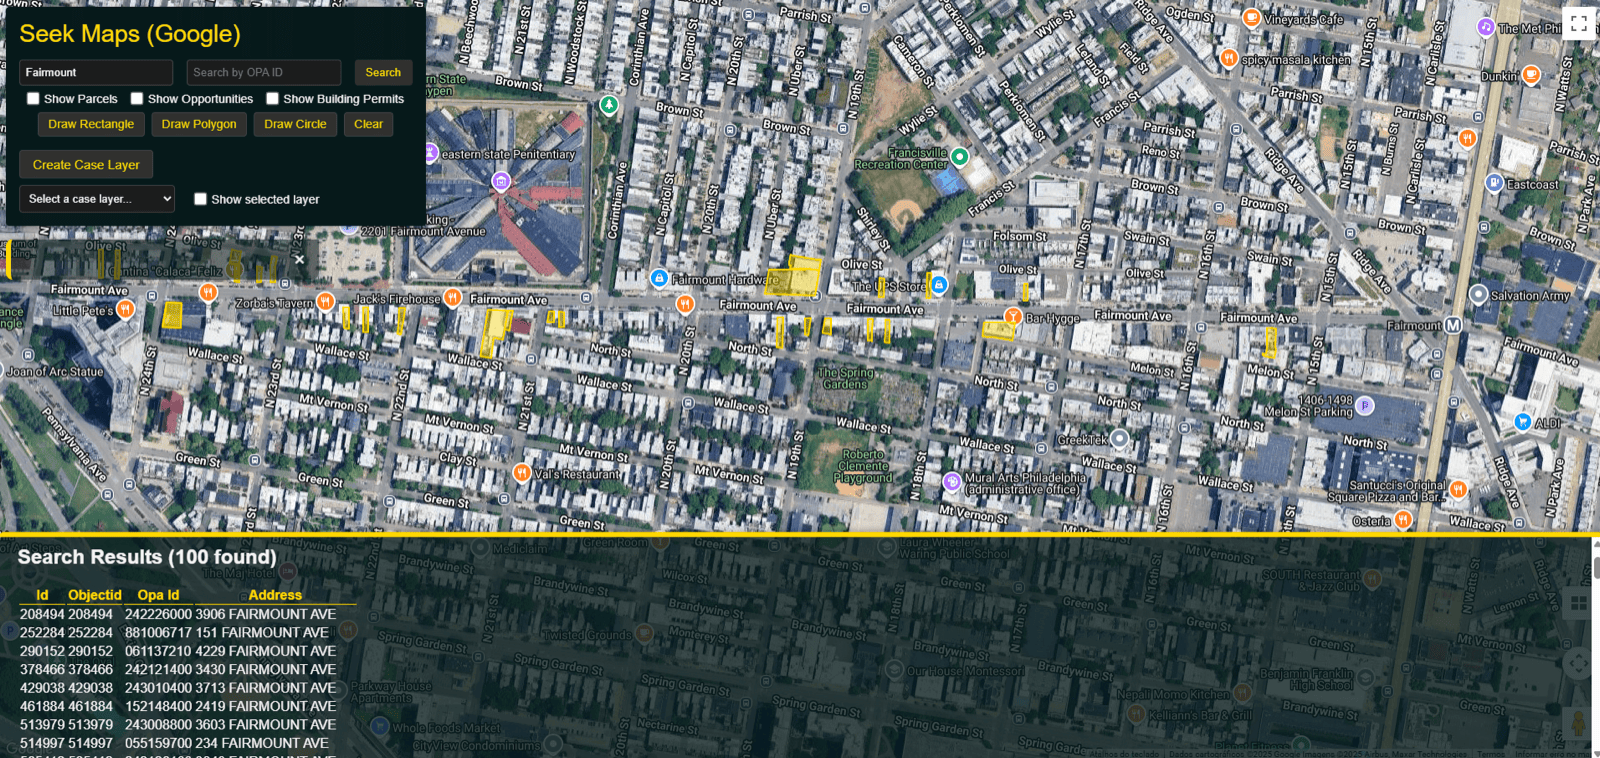
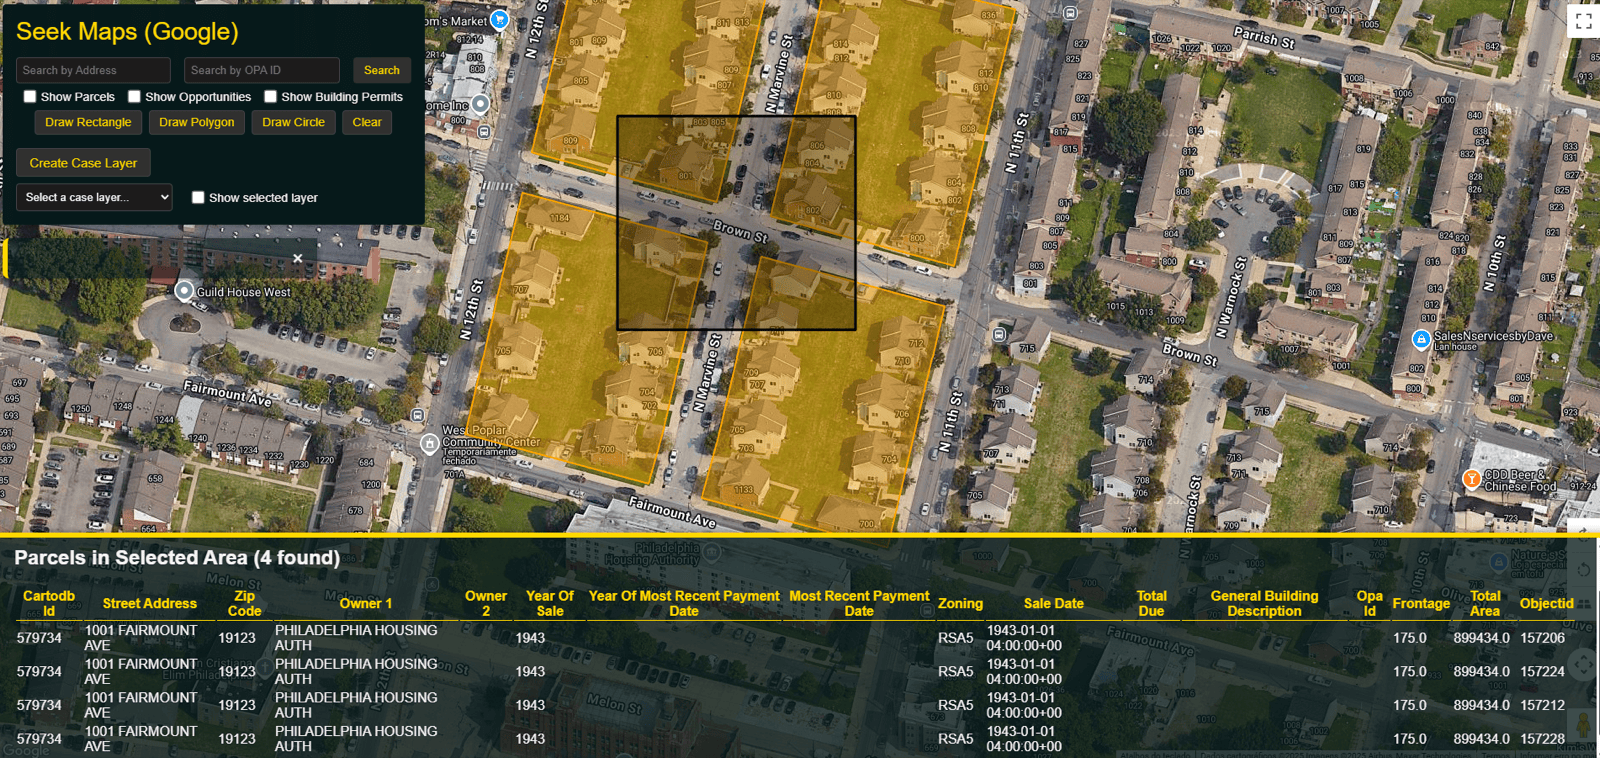
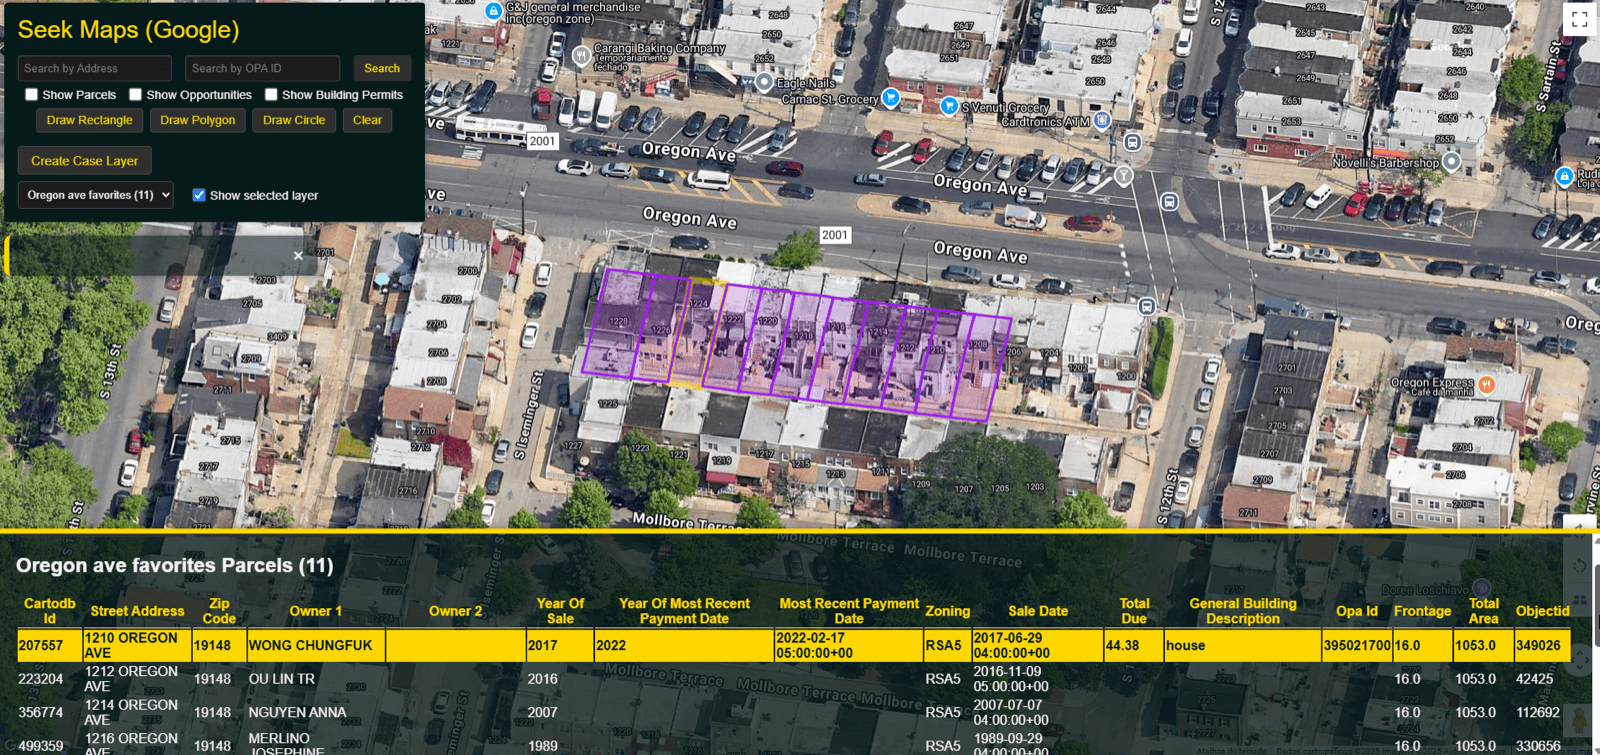
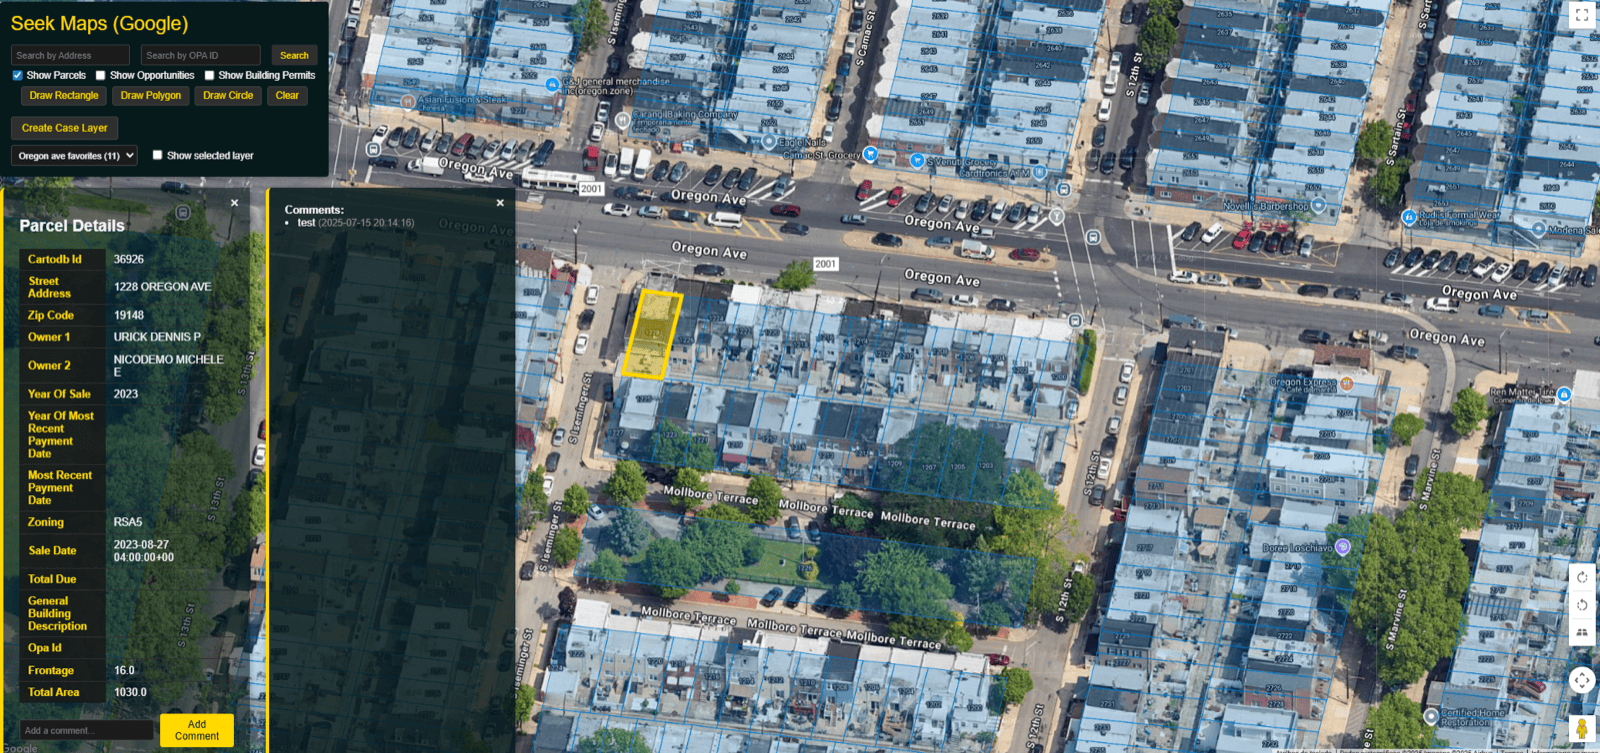
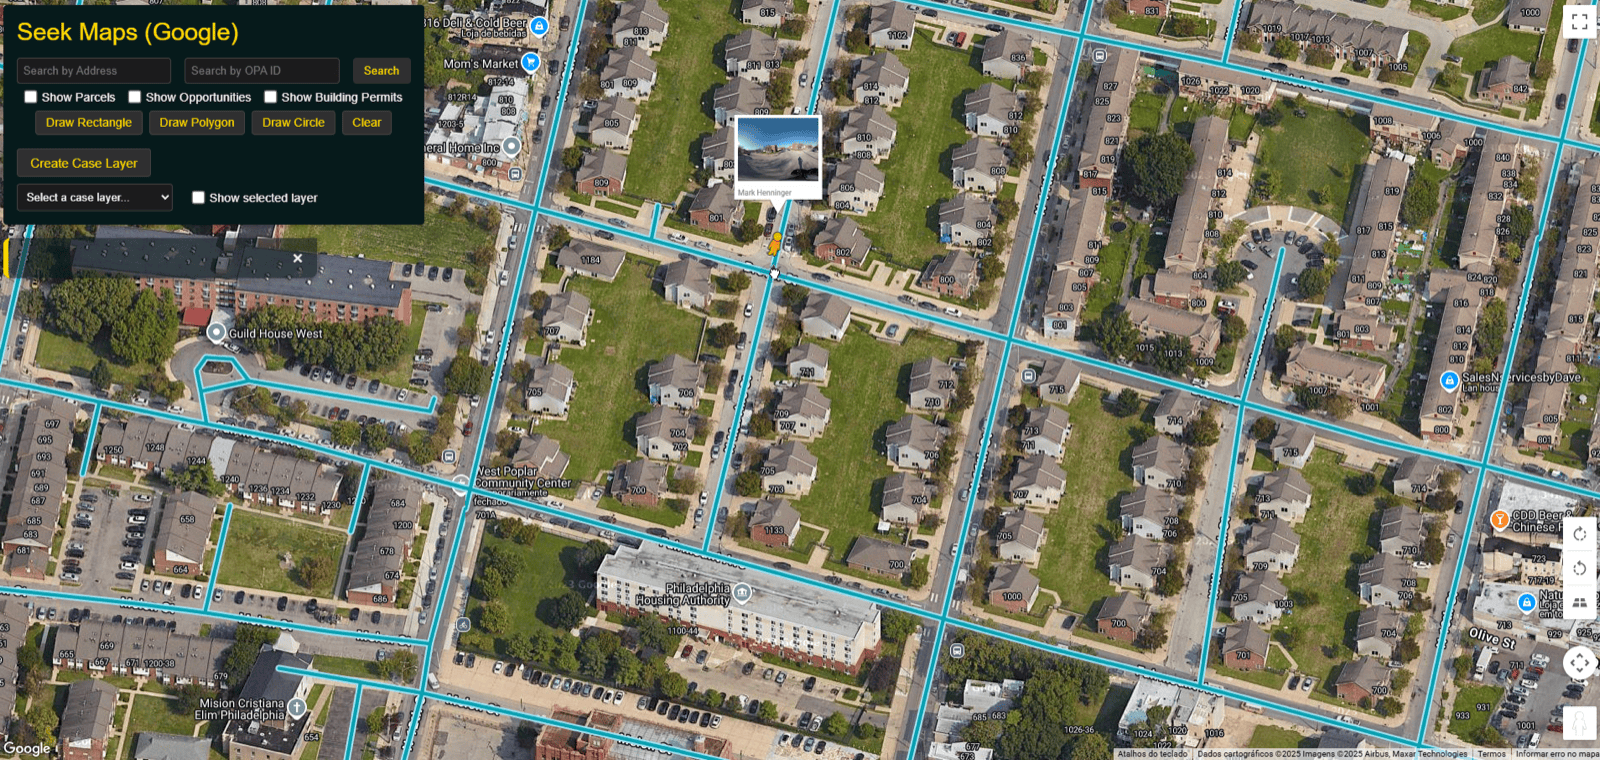
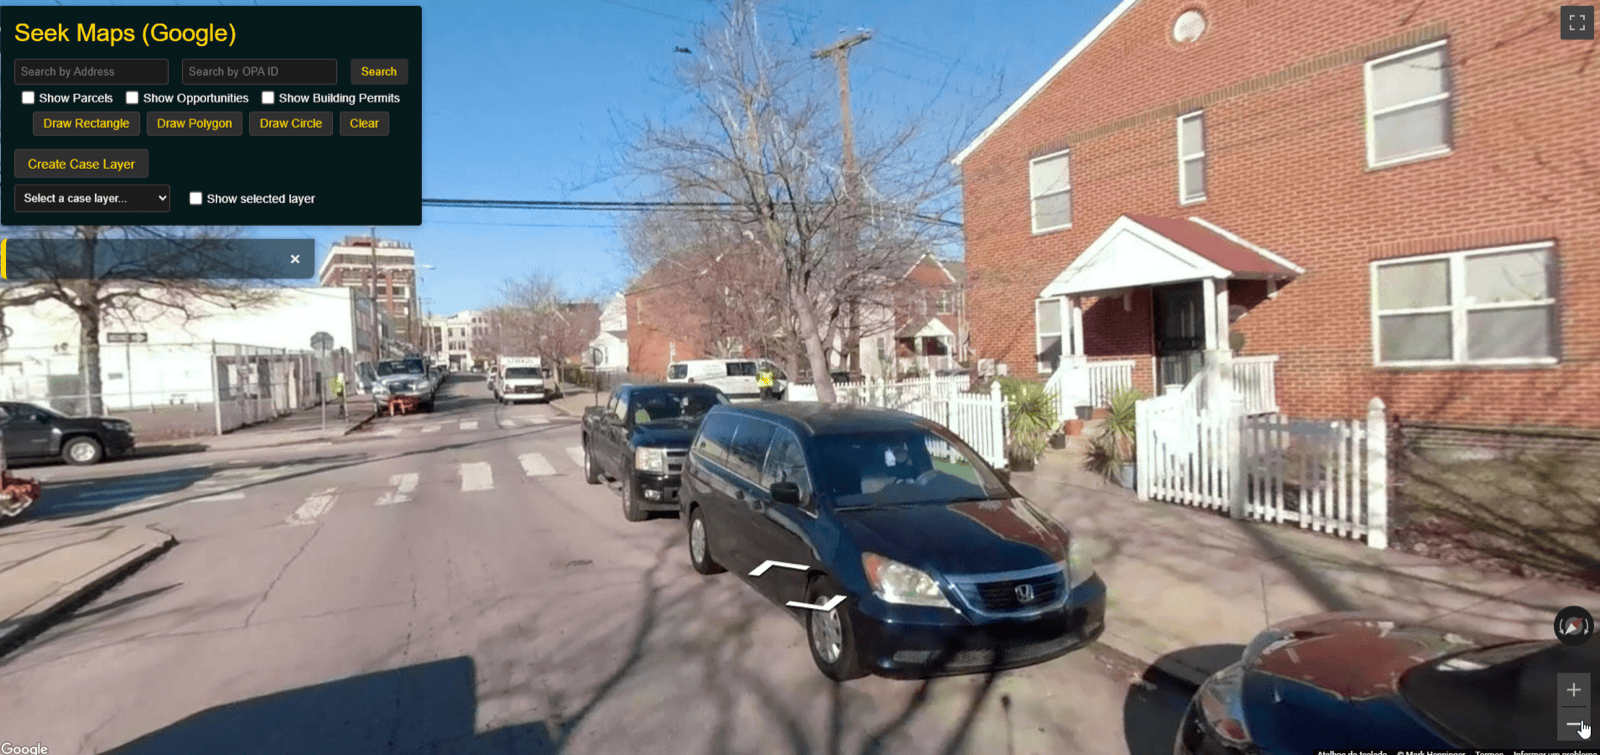
Search a block, select the parcels that matter, read the record behind each one, and step onto the street without leaving the map.
Built for fast, repeatable parcel research
Multi-layer GIS visualization
Parcels, opportunities, and building permits as independent layers — toggle them on and off to isolate exactly what you're analysing.
Dynamic parcel selection
Rectangle, polygon, and circle tools return every parcel in the selected area with its normalized record attached.
Custom layer creation
Save any working set of parcels as a named case layer, then reopen it whenever the analysis moves forward.
Parcel search
Look up properties by street address or OPA ID and jump straight to them on the map.
Google Street View
Street-level imagery wired into the parcel layer, so condition checks happen in the same window as the data.
Deployed in SharePoint
Rolled out inside the workspace the team already uses — no new platform to license, provision, or learn.
Immediate access to normalized, geolocated data
From scattered municipal portals and manual spreadsheet reconciliation to a single map the team opens in SharePoint — rapidly deployed, low-cost, and built so that opportunity decisions are made on data rather than guesswork.
The stack behind the map
Python
For the custom ETL that collects and normalizes public property data.
Microsoft Azure
Data Factory orchestrating the pipeline on a schedule, with SQL Server and PostGIS behind it.
Power BI
For the mapping interface and the analytics layered on top of it.
Google APIs
For satellite imagery and the Street View integration inside the map.
Enterprise-grade analysis without the enterprise price tag.